
.avif)
How to connect to the Datadog MCP with Claude Code (4 steps)


When an alert fires, engineers follow a predictable loop: open Datadog, find the failing monitor, cross-reference the APM trace, then switch back to the terminal to dig into the code. Every context switch adds friction when speed matters most.
To help developers query Datadog monitors, metrics, and logs without leaving their coding session, we'll show you how to connect Datadog with Merge Agent Handler's Datadog MCP server.
How it works
Merge Agent Handler connects Claude Code to Datadog's observability data through a single CLI setup. You install the Merge CLI, authenticate once, and register the connection with one command. Agent Handler manages your Datadog credentials centrally so you don't store API keys locally or embed them into your codebase.
Here's the command that registers the connection:
Related: How to use a Datadog MCP with Codex
Prerequisites
Before getting started, you'll need the following:
- A Merge Agent Handler account
- Claude Code installed (run
claude --versionto confirm) - pipx installed (run
pipx --versionto confirm, or install viapip install pipx) - A Datadog account with access to the environments you want to monitor
If you want to connect Merge Agent Handler's Datadog MCP with internal or customer-facing agentic products, you can follow the steps in our docs.
1. Install the Merge CLI
Install with pipx: pipx install merge-api
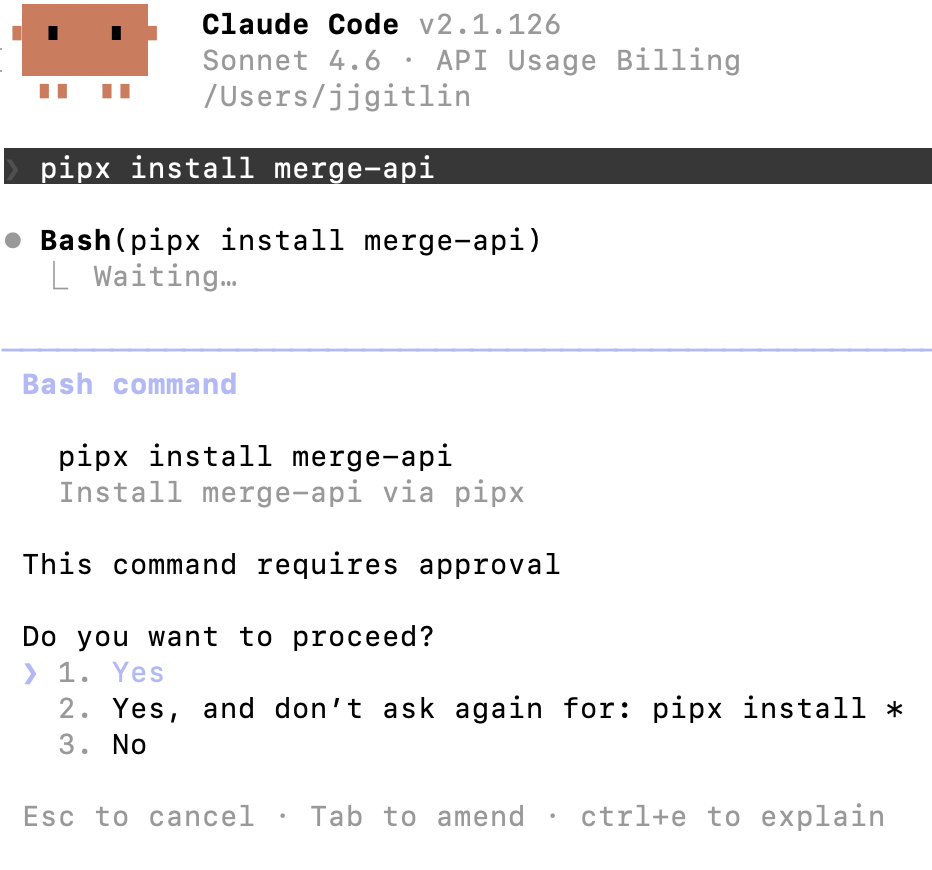
Confirm the install completed: merge --version
2. Configure the CLI and log in
Log in to connect the CLI to your Merge Agent Handler account: merge login
The CLI is now authenticated and ready to make authorized requests on your behalf.
3. Add Agent Handler to Claude Code
Register the Agent Handler MCP server with Claude Code:
Or manually:
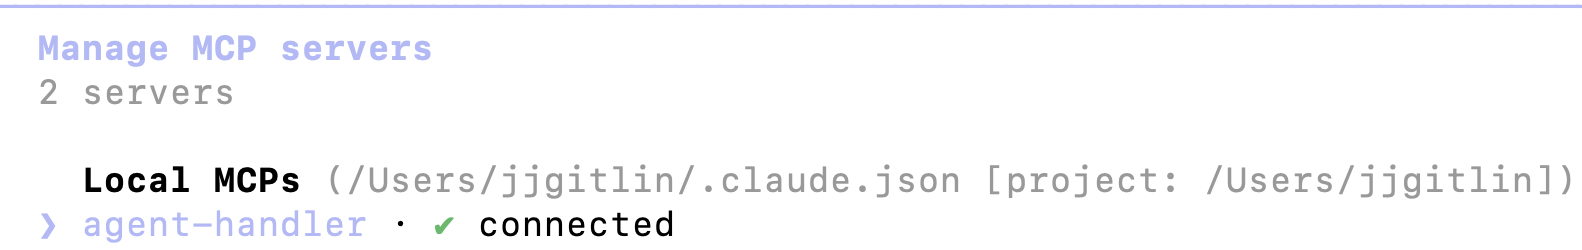
Verify the connection registered. Open Claude Code and run: /mcp
agent-handler should appear under Local MCPs with a connected status.
Related: How to integrate a Datadog MCP with Cursor
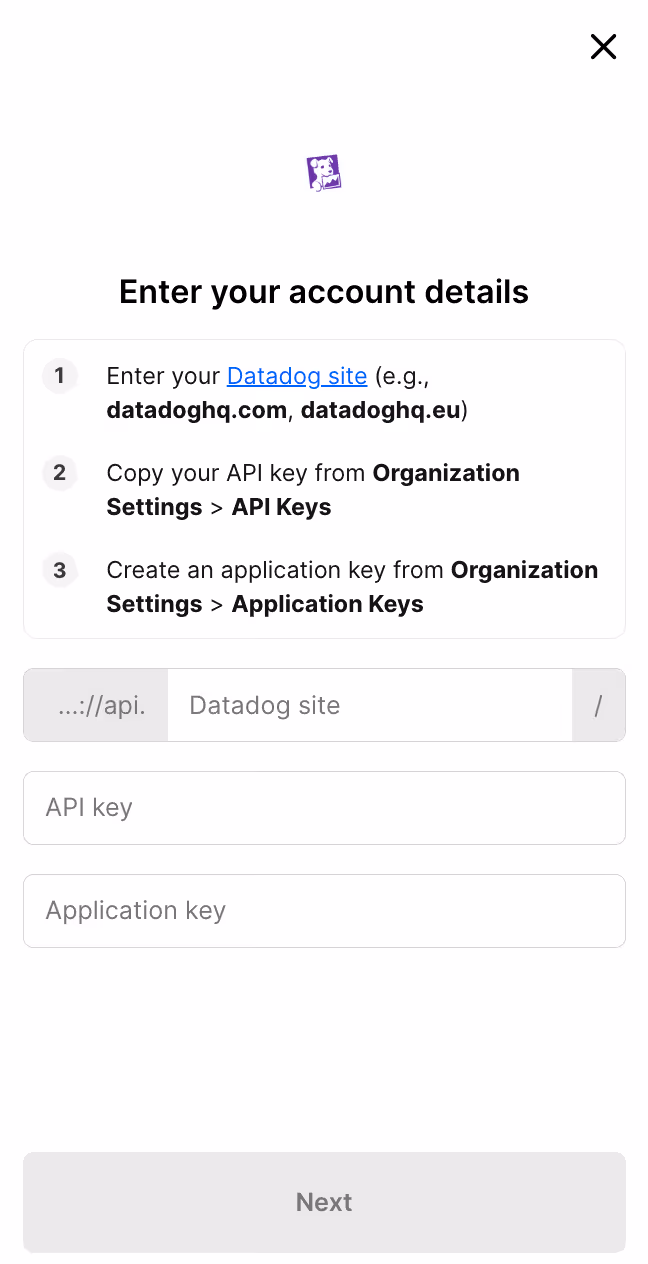
4. Authenticate Datadog
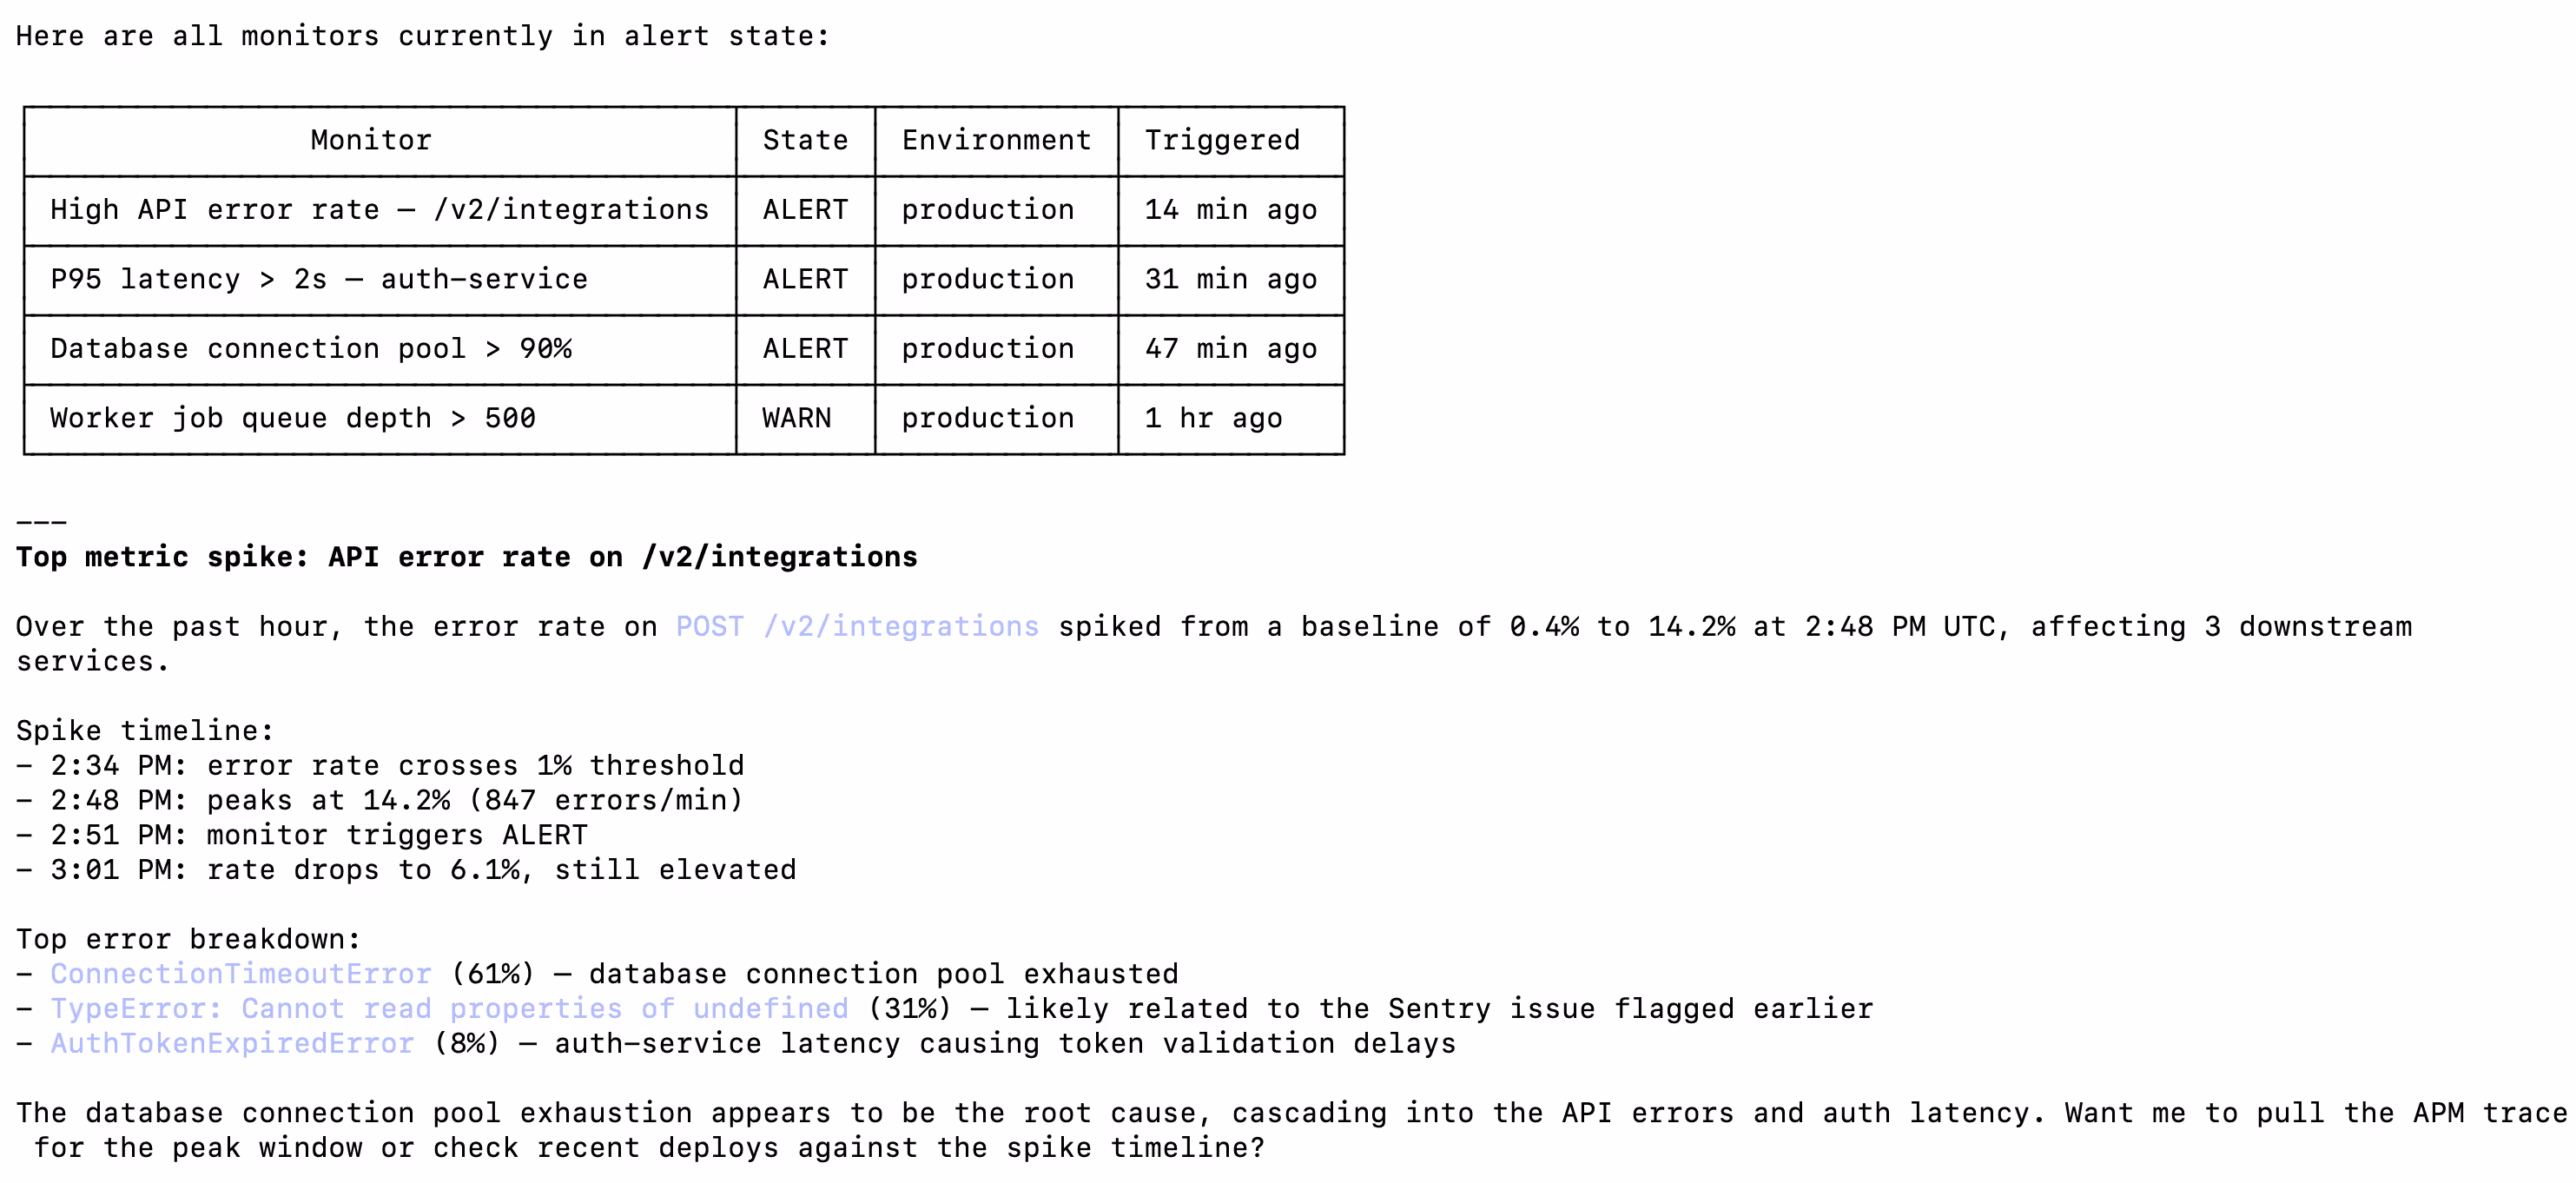
Open Claude Code and test the connection with a prompt like: "Show me all monitors currently in an alert state and summarize the top metric spike from the past hour."
A Magic Link will appear on first use to complete connector authentication.
You should then see an output that looks like the following:
{{this-blog-only-cta}}
Datadog MCP FAQ
In case you have more questions on setting up and using the Datadog MCP in Claude Code, we've addressed several more commonly-asked questions below.
What can you do once the Datadog MCP is connected to Claude Code?
With Datadog connected, Claude Code can:
- List and inspect monitors: retrieve all monitors in a given state (alert, warn, ok) across your environments without opening a browser
- Query metrics: pull time-series data for any metric to understand trends or spikes while you're debugging in the terminal
- Search logs: surface recent log events by service, environment, or query string to trace errors back to their source
- Read APM traces: fetch trace data for slow or failing requests to identify latency bottlenecks directly alongside your code
- Check dashboard data: retrieve widget data from existing dashboards to get a snapshot of system health mid-incident
Why use Merge Agent Handler vs. a self-hosted Datadog MCP server?
You can build a self-hosted MCP server that calls Datadog's API directly. For a solo developer on a single team, that works.
It breaks down when your team grows. Self-hosting means distributing Datadog API keys and application keys across developers, rotating them manually when someone offboards, and maintaining the server yourself as Datadog's API changes. There's also no central audit trail: if an agent queries or modifies a monitor during an incident, you have no record of what it accessed.
Merge Agent Handler is a managed MCP layer. It centralizes credential management, scopes access at the Tool Pack and Registered User level so each developer or agent only sees the monitors and metrics you choose to expose, and logs every tool call. When you need to know what your agent queried at 2am during an incident, the audit trail is there.
For teams running agents against production observability data, Merge Agent Handler handles the credential overhead and adds the access controls that matter at scale.
Why connect Datadog to Claude Code?
Datadog is where your production health data lives. Claude Code is where you debug the code causing the problem. Right now those two environments don't talk: engineers copy metric values, paste log snippets, and screenshot dashboards to get context into their terminal.
With the Datadog MCP connected, Claude Code can query monitors, pull metrics, and search logs without leaving the session. That means you can describe an anomaly to Claude, have it retrieve the relevant Datadog data, and reason about the root cause alongside your codebase.
Engineers responding to a latency spike can ask Claude to pull the APM trace, correlate it with a recent deploy, and identify the slow function, all without a single browser tab.
.png)


